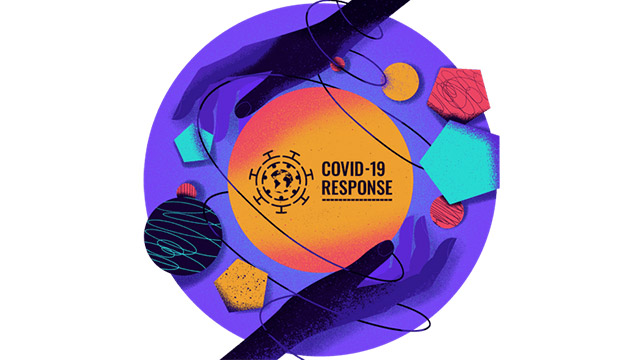
This time, we will introduce the content of the presentation titled "The COVID Tracking Project: 0 to 2M API Requests in 3 Months" from the "Jamstack Conference Virtual May 2020"!
- Table of Contents
The "Jamstack Conference" has a history of over 10 years and is hosted by Netlify, the cloud computing company that created Jamstack. Developers from around the world gather to discuss the design and development of the latest websites based on the Jamstack concept. The presentations are in English, but this blog will introduce them in Japanese.
Jamstack is still not very well known in Japan. We hope that everyone in Japan will feel closer to Jamstack!
The year 2020, when the coronavirus pandemic was becoming more serious.
A problem has occurred in America.
The accuracy of the information issued by the Centers for Disease Control and Prevention (CDC) in the United States has become statistically unreliable. Therefore, a project was formed by a group of volunteers to "consolidate the statistical information issued individually by the health departments of each state!"
In this article,
- Project Formation Background
- Reasons for Building the Project Site with Jamstack
We will explain about it.
― Background of Project Formation ―
1. Lack of sample size (number of tests)
The positivity rate can be calculated based on the number of tests rather than the population of a specific area. For example, even if there are 2 positive cases in a village of 1,000 people, if the number of tests conducted is 10, the positivity rate would be 20%.
The Centers for Disease Control and Prevention (CDC) initially announced the number of tests and positive cases. However, they stopped announcing the number of tests partway through. In other words, it became impossible to know the positivity rate because the denominator was unknown.
On the other hand, each testing institution was required to report the positivity rate to the state insurance authorities. Therefore, we divided the work and collected data on the number of tests from the websites of all health departments in the United States, compiling it into a spreadsheet for publication. From there, we aimed to gauge the spread of infections and the positivity rate in the country.
2. Infection Status Tracking Project
When this was reported in the media, volunteers were recruited to engage seriously in the effort. Erin Kisein, the speaker, is one of those who responded to the call.
She thought that a prompt response was necessary...
- Contact a talented developer friend, and the site will be released in 4 days
- Enhanced the site design over the following month
A privately initiated project, which emerged naturally while the esteemed national agency CDC was unable to provide data, has become the only source of data measuring the comprehensive infection rate in the United States.
3. Meeting the Needs of Society

Eventually, more media outlets and local stations began to rely on this data to understand the social impact of the coronavirus infection, its effects on local communities, and comparisons with other states. The project has inadvertently come to carry the significant meaning of "Public Data Rescue."
And ultimately, hundreds of staff participated. Among them are public health experts, data scientists, designers, and also individuals without specific skills who are eager to help, dedicating their time to data discovery and input.
― Reasons for Building the Project Site with Jamstack ―
4. Site Renewal
As a result of rapidly attracting talent and attention since the launch of the site, it was transformed into a more professional site after one month. This is the site that is still operational today.
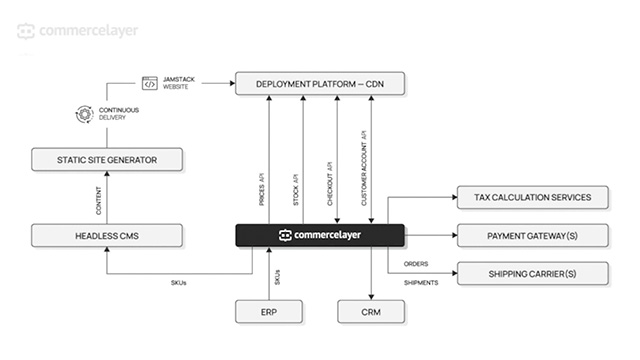
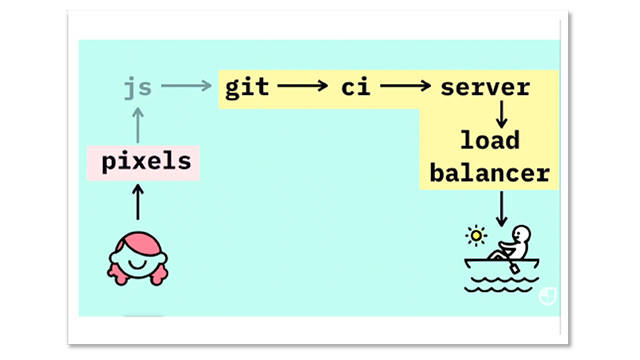
This site is built using the following technologies.
- Hosting: Netlify
- Build: Gatsby
- Data: Google Sheet
- CMS: Contentful
As a result, the service that exceeds 2 million API requests per day has been able to operate stably in just 3 months.
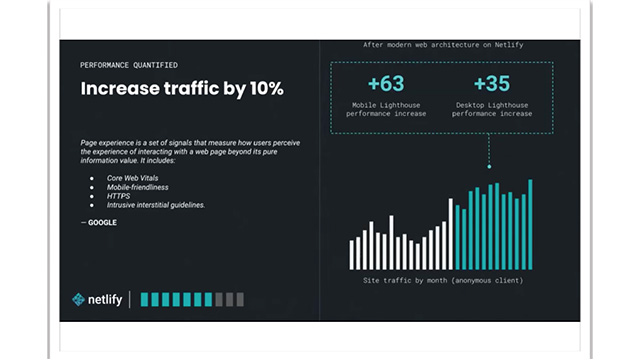
5. Site Robustness
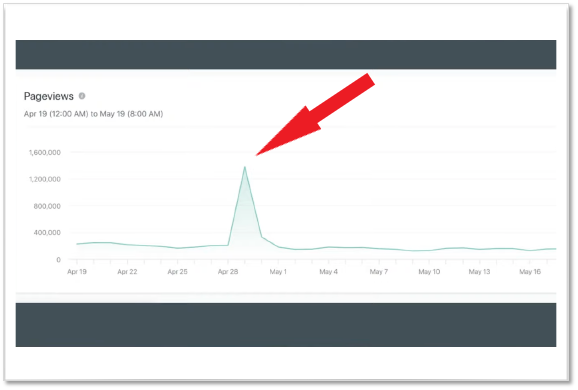
On April 29, we can see adramatic increase in site traffic. On this day, the White House referenced the data from this project and announced policies.
It is noteworthy that at this time, the project stakeholders did not notice any anomalies on the site. Without being affected by the surge in traffic, the site operated as usual.
As of March 7, 2021, this project has completed its role. Currently, a message stating, "Please refer to the data provided by the government" is displayed.
6. Summary
This case study, which was able to build a socially meaningful site and stabilize its operation in just three months, is valuable.
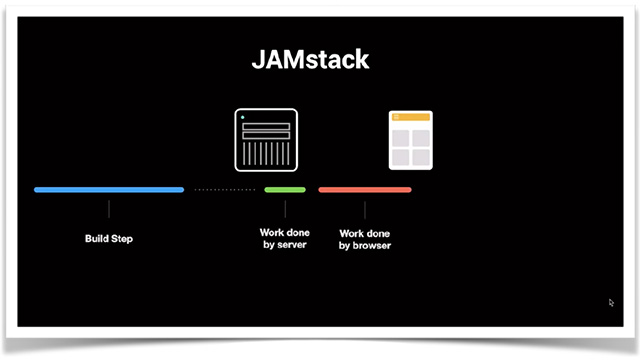
She stated in her presentation that "It would not have been possible without Jamstack".
How was it?
This time, rather than a technical learning experience, could it be that the following facts were corroborated from the memoirs of the speaker, Erin Kisein, at that time?
Jamstack includes,
- Speed
- Stability
- Traffic Processing
It means that there is a competitive advantage that cannot be found anywhere else!
Thank you for reading until the end.
Human Science Co., Ltd. provides solutions for web content and platforms using a unique combination of "document production know-how" and "the latest web development technology (Jamstack)" that is not available from other companies.
If you are interested, please feel free to contact us here!
Human Science Co., Ltd.
https://www.science.co.jp/document/jamstack.html
Source of this document: https://www.youtube.com/watch?v=ryngYoHXNfQ